The Atlas
Barangays in Quezon
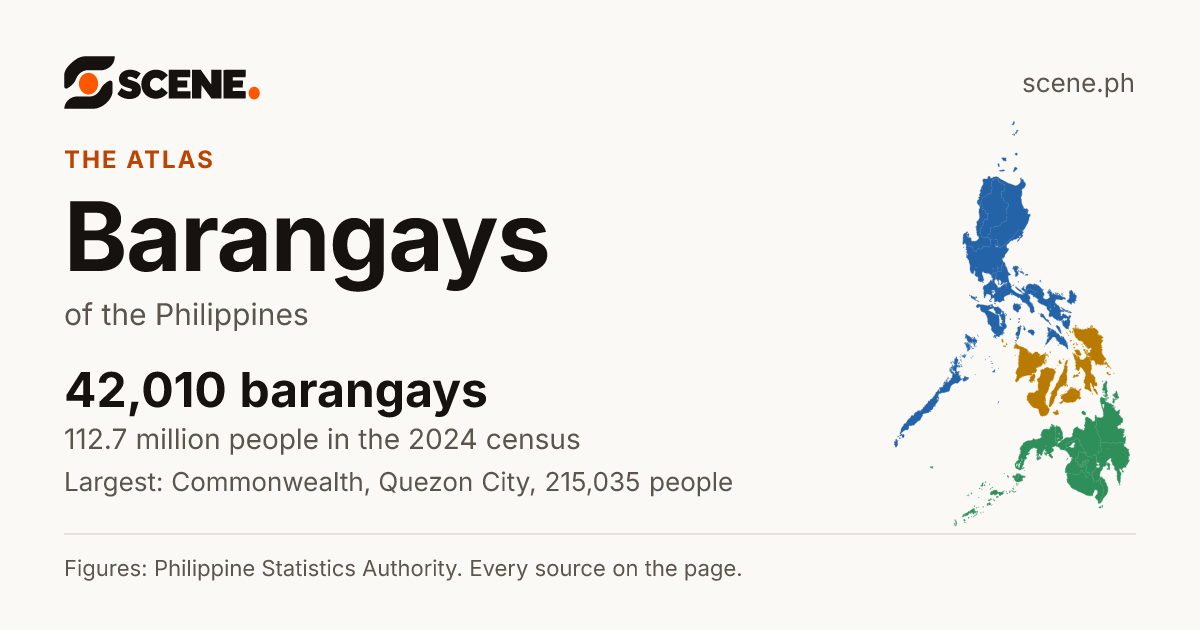
The barangay is the smallest local government: where the government's plans and services reach the community, and where neighbours settle disputes.[1] A punong barangay, often called the kapitan, leads it with seven elected kagawad and the chairperson of the Sangguniang Kabataan.[1]
A barangay is created by law or by an ordinance of its province or city, and only when its voters approve it in a plebiscite. It needs at least 2,000 people, or 5,000 in Metro Manila and the highly urbanized cities.[1]
This is how the link shows on Facebook, Messenger, Viber, WhatsApp and X.
Or share on
- Share on Facebook (opens in a new tab)
- Share on WhatsApp (opens in a new tab)
- Share on Viber (opens the Viber app)
- Share on X (opens in a new tab)
- Share on Telegram (opens in a new tab)
- Share on Threads (opens in a new tab)
- Share on LINE (opens in a new tab)
- Share on LinkedIn (opens in a new tab)
- Share on Reddit (opens in a new tab)
- Share on Pinterest (opens in a new tab)
- Share on Bluesky (opens in a new tab)
- Share on Tumblr (opens in a new tab)
- Share by SMS (opens your messages app)
- Share by Email
Viber opens the Viber app on this device. Without it, copy the link above.
Barangays in Quezon, at a glance
- Barangays
- 1,242[2]
- People, 2024CensusA count of every person in the country, all on one day. The 2024 census counted people as they were on 1 July 2024.More in the glossary
- 2,260,669[3]
- Urban or ruralUrban barangayThe PSA counts a barangay as urban when it has 5,000 people or more, or a big employer, or several businesses and public services close by. Every barangay in Metro Manila is urban.More in the glossary
- 140 urban[4]
- 1,102 rural, as the PSA classes each barangay.
- Largest by landLand areaThe land inside the place's official boundary. A square kilometre is a square 1 km on each side, about the size of 140 football fields.More in the glossary
- Umiray[6]
- General Nakar, Quezon
- about 433.81 km²
- Fastest growing, 5,000 people or moreGrowth a yearHow fast the number of people changed each year between two censuses. 1% a year means about 1 more person for every 100 people, each year.More in the glossary
- Sampaloc Santo Cristo[5, 7]
- Sariaya, Quezon
- 4.85% a year, 2020 to 2024
- Fewer people than in 2020Growth a yearHow fast the number of people changed each year between two censuses. 1% a year means about 1 more person for every 100 people, each year.More in the glossary
- 491 barangays[7]
- Of those with 5,000 people or more, the steepest fall: Market View, −3.09% a year.
Town: All
- All
- Agdangan
- Alabat
- Atimonan
- Buenavista
- Burdeos
- Calauag
- Candelaria
- Catanauan
- Dolores
- General Luna
- General Nakar
- Guinayangan
- Gumaca
- Infanta
- Jomalig
- Lopez
- Lucban
- Lucena City
- Macalelon
- Mauban
- Mulanay
- Padre Burgos
- Pagbilao
- Panukulan
- Patnanungan
- Perez
- Pitogo
- Plaridel
- Polillo
- Quezon
- Real
- Sampaloc
- San Andres
- San Antonio
- San Francisco
- San Narciso
- Sariaya
- Tagkawayan
- Tayabas City
- Tiaong
- Unisan
Sort: Most people
Each row is a barangay, with its 2024 census figures. Choose a column heading or a sort button to order the list, and choose it again to turn the order round. Narrow it with the menus.
1,242 barangays, 351 to 400 shown, most people first.
| Rank | Name | People, 2024 | People per km² | Area | Growth, 2020–2024 | Urban or rural |
|---|---|---|---|---|---|---|
| 351 | InaclaganGumaca, Quezon | 1,931 | about 392 | about 4.93 km² | −0.34% a year | Rural |
| 352 | TanauanReal, Quezon | 1,928 | about 103 | about 18.63 km² | 0.53% a year | Rural |
| 353 | DanlaganPadre Burgos, Quezon | 1,927 | about 616 | about 3.13 km² | 0.65% a year | Rural |
| 354 | Barangay 1Sariaya, Quezon | 1,922 | about 12,645 | about 0.152 km² | 0.70% a year | Rural |
| 355 | AntipoloSariaya, Quezon | 1,908 | about 397 | about 4.81 km² | 0.25% a year | Rural |
| 356 | PinagbayananCalauag, Quezon | 1,908 | about 9,636 | about 0.198 km² | −2.04% a year | Rural |
| 357 | Caridad IlayaAtimonan, Quezon | 1,907 | about 332 | about 5.74 km² | 0.14% a year | Rural |
| 358 | San Vicente KanluranCatanauan, Quezon | 1,907 | about 149 | about 12.81 km² | 0.55% a year | Rural |
| 359 | San VicenteSan Narciso, Quezon | 1,906 | about 197 | about 9.66 km² | 0.28% a year | Rural |
| 360 | TabasonTagkawayan, Quezon | 1,893 | about 120 | about 15.72 km² | −0.50% a year | Rural |
| 361 | SipaPadre Burgos, Quezon | 1,886 | about 148 | about 12.71 km² | 0.42% a year | Rural |
| 362 | Barangay 6Lucban, Quezon | 1,884 | about 36,797 | about 0.0512 km² | 0.52% a year | Rural |
| 363 | Kinatihan ICandelaria, Quezon | 1,884 | about 311 | about 6.06 km² | −2.24% a year | Rural |
| 364 | Ilayang OwainSampaloc, Quezon | 1,883 | about 210 | about 8.95 km² | −0.83% a year | Rural |
| 365 | LoobSan Antonio, Quezon | 1,881 | about 1,373 | about 1.37 km² | −2.35% a year | Rural |
| 366 | HagakhakinGumaca, Quezon | 1,880 | about 618 | about 3.04 km² | 1.37% a year | Rural |
| 367 | San MiguelLopez, Quezon | 1,880 | about 150 | about 12.57 km² | 0.05% a year | Rural |
| 368 | TaluongPolillo, Quezon | 1,879 | about 128 | about 14.64 km² | −0.84% a year | Rural |
| 369 | Kinatihan IICandelaria, Quezon | 1,878 | about 388 | about 4.84 km² | −0.57% a year | Rural |
| 370 | PagdadamayanSan Narciso, Quezon | 1,876 | about 1,590 | about 1.18 km² | 1.63% a year | Rural |
| 371 | RansohanLucena City, Quezon | 1,874 | about 4,240 | about 0.442 km² | 2.35% a year | Rural |
| 372 | WalayPadre Burgos, Quezon | 1,866 | about 781 | about 2.39 km² | 2.19% a year | Rural |
| 373 | TongkoTayabas City, Quezon | 1,861 | about 710 | about 2.62 km² | −1.98% a year | Urban |
| 374 | TanauanPlaridel, Quezon | 1,853 | about 831 | about 2.23 km² | 0.55% a year | Rural |
| 375 | ConcepcionMauban, Quezon | 1,838 | about 688 | about 2.67 km² | −1.30% a year | Rural |
| 376 | LakawanTayabas City, Quezon | 1,826 | about 379 | about 4.82 km² | 1.89% a year | Rural |
| 377 | BambanTagkawayan, Quezon | 1,824 | about 140 | about 13.06 km² | 2.67% a year | Rural |
| 378 | MaligayaSan Narciso, Quezon | 1,824 | about 4,026 | about 0.453 km² | 0.60% a year | Rural |
| 379 | SampagaSan Antonio, Quezon | 1,824 | about 1,184 | about 1.54 km² | 2.75% a year | Rural |
| 380 | San FranciscoTiaong, Quezon | 1,814 | about 546 | about 3.32 km² | −0.09% a year | Rural |
| 381 | Minahan SurGeneral Nakar, Quezon | 1,813 | about 261 | about 6.95 km² | −1.57% a year | Rural |
| 382 | Barangay VQuezon, Quezon | 1,809 | about 1,350 | about 1.34 km² | 0.52% a year | Rural |
| 383 | Barangay 8Catanauan, Quezon | 1,808 | about 17,057 | about 0.106 km² | −1.16% a year | Rural |
| 384 | CalwitSan Narciso, Quezon | 1,808 | about 94 | about 19.16 km² | 1.40% a year | Rural |
| 385 | Poblacion IIAgdangan, Quezon | 1,800 | about 6,207 | about 0.29 km² | −2.38% a year | Rural |
| 386 | BuhanginAtimonan, Quezon | 1,796 | about 898 | about 2.00 km² | 0.07% a year | Rural |
| 387 | Barangay 9Catanauan, Quezon | 1,795 | about 5,311 | about 0.338 km² | 0.43% a year | Urban |
| 388 | AjosMulanay, Quezon | 1,791 | about 424 | about 4.22 km² | 2.18% a year | Rural |
| 389 | ManggahanDolores, Quezon | 1,787 | about 455 | about 3.93 km² | 3.65% a year | Rural |
| 390 | Barangay 11Lucena City, Quezon | 1,785 | about 7,863 | about 0.227 km² | −2.98% a year | Urban |
| 391 | Barangay 7Lucban, Quezon | 1,784 | about 34,912 | about 0.0511 km² | −3.82% a year | Rural |
| 392 | AlibihabanSan Andres, Quezon | 1,778 | about 382 | about 4.65 km² | 0.55% a year | Rural |
| 393 | AjosCatanauan, Quezon | 1,770 | about 413 | about 4.29 km² | 1.35% a year | Rural |
| 394 | BrionesSan Antonio, Quezon | 1,769 | about 505 | about 3.50 km² | −1.09% a year | Rural |
| 395 | AbiawinInfanta, Quezon | 1,761 | about 1,159 | about 1.52 km² | 1.03% a year | Rural |
| 396 | SisiGuinayangan, Quezon | 1,759 | about 1,035 | about 1.70 km² | −0.62% a year | Rural |
| 397 | Bagong SilangBuenavista, Quezon | 1,755 | about 471 | about 3.73 km² | 1.40% a year | Rural |
| 398 | MalusakAtimonan, Quezon | 1,755 | about 329 | about 5.34 km² | 0.26% a year | Rural |
| 399 | PoblacionGuinayangan, Quezon | 1,754 | about 16,393 | about 0.107 km² | −0.45% a year | Rural |
| 400 | MagsikapGeneral Nakar, Quezon | 1,747 | about 40 | about 43.23 km² | −1.92% a year | Rural |
How it fits
A barangay is the smallest unit of government, led by a punong barangay (the kapitan) and a council of kagawad. Every city and municipality is made up of barangays.
Sources
The list shows each place's own figures: people from the PSA's 2024 census, growth from its 2020 census, land areas from the Land Management Bureau's 2019 masterlist. A barangay's area is measured inside its border on UN OCHA's map and is approximate, and a barangay shows no growth where its border changed after 2020. Every figure's source is on its place's page; how Scene works out the rest.
- 1.Congress of the Philippines. Republic Act No. 7160: the Local Government Code of 1991. Published October 10, 1991. Read by Scene October 2, 2026. Philippine government work, no copyright (Republic Act No. 8293, Section 176.1). Open the source
- 2.Philippine Statistics Authority. Philippine Standard Geographic Code (PSGC), 2nd Quarter 2026: Publication Datafile. Published June 30, 2026. Read by Scene September 24, 2026. CC BY (PSA Terms of Use). Open the source
- 3.Philippine Statistics Authority. Population and Annual Population Growth Rate of the Philippines and its Regions, Provinces, and Highly Urbanized Cities Based on the 2010, 2015, 2020 and 2024 Population Census (OpenSTAT table 0211A6DAPG0). Published August 7, 2026. Read by Scene October 2, 2026. CC BY (PSA Terms of Use). Open the source
- 4.Philippine Statistics Authority. Total Population and Urban Population by Urban Classification and Region, Province, Highly Urbanized City, City/Municipality and Barangay: Philippines, 2024 (OpenSTAT table 0231A6DPUP0). Published August 7, 2026. Read by Scene October 2, 2026. CC BY (PSA Terms of Use). Open the source
- 5.Philippine Statistics Authority. Total Population, Household Population, and Number of Households by Province, City, Municipality, and Barangay as of 01 July 2024: CALABARZON (OpenSTAT table 0041A6DTPH3). Published August 5, 2026. Read by Scene October 2, 2026. CC BY (PSA Terms of Use). Open the source
- 6.UN OCHA, from the PSA and NAMRIA. Philippines: Subnational Administrative Boundaries (COD-AB), barangay layer. Published February 13, 2025. Read by Scene September 25, 2026. CC BY-IGO 3.0. Open the source
- 7.Philippine Statistics Authority. Philippine Standard Geographic Code (PSGC), 4th Quarter 2022: Publication Datafile, with the 2015 and 2020 census counts (the PSA's file, as the Internet Archive keeps it). Published December 31, 2022. Read by Scene October 2, 2026. CC BY (PSA Terms of Use). Open the source
Scene adds what the sources do not print themselves: growth rates, shares, barangay areas and densities, coordinates, neighbours and distances, each computed from the figures and borders above. How each is made.
See something wrong on this page? Write to hello@scene.ph with the page address. We check every report against the source.