The Atlas
Every place in the Philippines
Every region, province, city, town and barangay, each with how many people live there, its map, and the places around it.
112,729,484 Filipinos counted in the 2024 census[3, 4]
The country's count includes 1,708 Filipinos in the Philippines' embassies, consulates and missions abroad, whom the census counts in no region.[3]
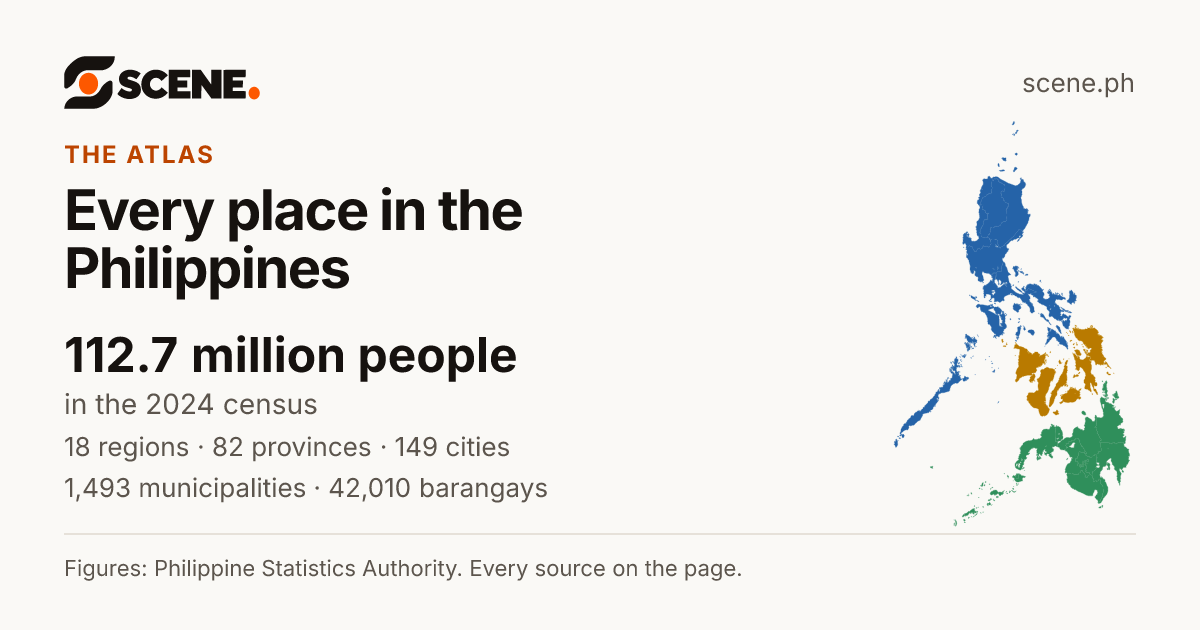
This is how the link shows on Facebook, Messenger, Viber, WhatsApp and X.
Or share on
- Share on Facebook (opens in a new tab)
- Share on WhatsApp (opens in a new tab)
- Share on Viber (opens the Viber app)
- Share on X (opens in a new tab)
- Share on Telegram (opens in a new tab)
- Share on Threads (opens in a new tab)
- Share on LINE (opens in a new tab)
- Share on LinkedIn (opens in a new tab)
- Share on Reddit (opens in a new tab)
- Share on Pinterest (opens in a new tab)
- Share on Bluesky (opens in a new tab)
- Share on Tumblr (opens in a new tab)
- Share by SMS (opens your messages app)
- Share by Email
Viber opens the Viber app on this device. Without it, copy the link above.
How the country is divided
Five levels, from the biggest to the smallest. Each one fits inside the one above it. Pick a level to see every place in it.
- Island groupsLuzon, the Visayas, Mindanao: a grouping, not a government3
- RegionsBig areas that group provinces18
- ProvincesEach led by a governor82
- Cities and municipalitiesEach led by a mayor1,642
Of these, 149 cities and 1,493 municipalities.
- BarangaysThe smallest unit, led by a punong barangay (kapitan)42,010
The bars use a stretched scale, so the small numbers still show.
Old maps of the Philippines
Each with the archive that holds it, its date and its rights, on its own page.


Stories from the Philippines
Short films of the country, every line from a source listed under the film.

The 18 regions, by people
Each island group and its regions. The longer the bar, the more people live there.
The Philippines, census by census
From 3,096,031 people in 1840 to 112,729,484 in 2024.
Every count
| Year | People |
|---|---|
| 2024 | 112,729,484[5] |
| 2020 | 109,033,245[5] |
| 2015 | 100,979,303[5] |
| 2010 | 92,335,113[5] |
| 2007 | 88,546,087[5] |
| 2000 | 76,485,088[5] |
| 1995 | 68,613,706[5] |
| 1990 | 60,703,810[5] |
| 1980 | 48,098,460[5] |
| 1975 | 42,070,660[5] |
| 1970 | 36,684,486[5] |
| 1960 | 27,087,685[5] |
| 1948 | 19,234,182[5] |
| 1939 | 16,000,303[5] |
| 1918 | 10,314,310[5] |
| 1903 | 7,635,426[5] |
| 1896 | 6,261,339[5] |
| 1887 | 5,984,727[5] |
| 1877 | 5,567,685[5] |
| 1870 | 4,712,006[5] |
| 1858 | 4,290,381[5] |
| 1850 | 3,857,424[5] |
| 1840 | 3,096,031[5] |
The economy and poverty
The country's economy made ₱28.01 trillion of goods and services in 2025, ₱245,997 for each person. About 16 of every 100 Filipinos lived below the poverty line in 2023.
- Economy, 2025Gross domestic productThe value of all the goods and services made in a place in a year: the size of its economy. The PSA measures it for every region, province and highly urbanized city. Counted at 2018 prices, it leaves out the rise in prices, so one year can be set beside another.More in the glossary
- ₱28.01 trillion[6]The country's gross domestic product at current prices; ₱23.23 trillion at 2018 prices.
- Growth, 2024–2025
- 4.4%[7]How much more it made than the year before, at 2018 prices.
- For each person, 2025
- ₱245,997[8]The economy divided by the projected population, at current prices, as the PSA works it out.
The PSA's survey puts it between 15.1% and 16.0%, with 95% confidence. The poverty line was ₱33,296 a person for the year.
Sources for this page
- 1.UN OCHA, from the PSA and NAMRIA. Philippines: Subnational Administrative Boundaries (COD-AB), barangay layer. Published February 13, 2025. Read by Scene September 25, 2026. CC BY-IGO 3.0. Open the source
- 2.OpenStreetMap contributors. Barangay boundaries from OpenStreetMap, where UN OCHA's layer has none. Published September 25, 2026. Read by Scene September 25, 2026. ODbL 1.0. Open the source
- 3.Philippine Statistics Authority. Population and Annual Population Growth Rate of the Philippines and its Regions, Provinces, and Highly Urbanized Cities Based on the 2010, 2015, 2020 and 2024 Population Census (OpenSTAT table 0211A6DAPG0). Published August 7, 2026. Read by Scene October 2, 2026. CC BY (PSA Terms of Use). Open the source
- 4.Philippine Statistics Authority. Philippine Standard Geographic Code (PSGC), 2nd Quarter 2026: Publication Datafile. Published June 30, 2026. Read by Scene September 24, 2026. CC BY (PSA Terms of Use). Open the source
- 5.Philippine Statistics Authority. Philippine Statistical Yearbook, Table 1.4: Population of the Philippines, census years 1840 to 2024 (OpenSTAT table 0041A2BPOP0). Published June 4, 2026. Read by Scene October 2, 2026. CC BY (PSA Terms of Use). Open the source
- 6.Philippine Statistics Authority (PSA). Gross Regional Domestic Product, by Region (OpenSTAT table 0012B5BPGD1). Published April 23, 2026. Read by Scene October 2, 2026. CC BY (PSA Terms of Use). Open the source
- 7.Philippine Statistics Authority (PSA). Gross Regional Domestic Product, by Region, Growth Rates (OpenSTAT table 0022B5BPGD2). Published April 23, 2026. Read by Scene October 2, 2026. CC BY (PSA Terms of Use). Open the source
- 8.Philippine Statistics Authority (PSA). Per Capita Gross Regional Domestic Product, by Region (OpenSTAT table 0772B5BPCP1). Published April 23, 2026. Read by Scene October 2, 2026. CC BY (PSA Terms of Use). Open the source
- 9.Philippine Statistics Authority (PSA). Table 2a. Annual Per Capita Poverty Threshold and Poverty Incidence Among Population with Measures of Precision, by Region, Province and Highly Urbanized Cities: 2018, 2021, and 2023 (OpenSTAT table 0041F3DF02A). Published August 15, 2024. Read by Scene October 2, 2026. CC BY (PSA Terms of Use). Open the source
Scene adds what the sources do not print themselves: growth rates, shares, barangay areas and densities, coordinates, neighbours and distances, each computed from the figures and borders above. How each is made.
See something wrong on this page? Write to hello@scene.ph with the page address. We check every report against the source.