Municipality
Pagsanghan
Pagsanghan is a municipality in Samar, Eastern Visayas, Philippines. Its population was 8,145 in the 2024 census, and it has 13 barangays.
- Population: 2024 Census
- Places: PSGC 2Q 2026
- Checked by Scene: October 8, 2026
- Page updated: October 9, 2026
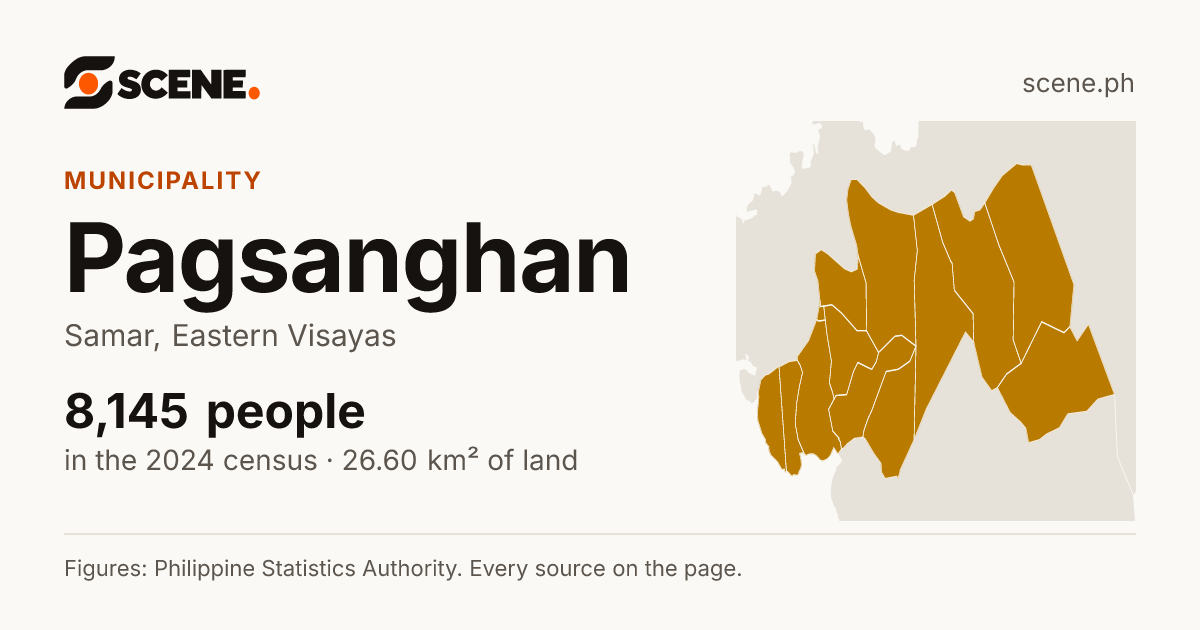
This is how the link shows on Facebook, Messenger, Viber, WhatsApp and X.
Or share on
- Share on Facebook (opens in a new tab)
- Share on WhatsApp (opens in a new tab)
- Share on Viber (opens the Viber app)
- Share on X (opens in a new tab)
- Share on Telegram (opens in a new tab)
- Share on Threads (opens in a new tab)
- Share on LINE (opens in a new tab)
- Share on LinkedIn (opens in a new tab)
- Share on Reddit (opens in a new tab)
- Share on Pinterest (opens in a new tab)
- Share on Bluesky (opens in a new tab)
- Share on Tumblr (opens in a new tab)
- Share by SMS (opens your messages app)
- Share by Email
Viber opens the Viber app on this device. Without it, copy the link above.
People · 2024 Census
- Under 690
- 690 to 1,100
- 1,100 to 1,800
- 1,800 to 3,100
- 3,100 and over
The same steps colour every map of barangays in the Atlas, so a colour means the same range everywhere.
Density · people per km², 2024
- Under 160
- 160 to 340
- 340 to 700
- 700 to 2,600
- 2,600 and over
The same steps colour every map of barangays in the Atlas, so a colour means the same range everywhere.
Growth a year · 2020–2024
- Fell by more than 1% a year
- Fell, by up to 1% a year
- Grew, by under 1% a year
- Grew by 1 to 2% a year
- Grew by 2% a year or more
Each place's yearly change between the 2020 and 2024 censuses, on the same steps as every map in the Atlas.
- Bangon
- Buenos Aires
- Calanyugan
- Caloloma
- Cambaye
- Canlapwas
- Libertad
- Pañge
- San Luis
- Santo Niño
- Viejo
- Villahermosa Occidental
- Villahermosa Oriental
PeopleSources
8,145
people counted in the 2024 censusCensusA count of every person in the country, all on one day. The 2024 census counted people as they were on 1 July 2024.More in the glossary
Up 1.5% from 2010 to 2024Rank by peopleSources
24th
of the 26 cities and municipalities of Samar by population, 2024Rank and shareWorked out by Scene from the PSA's counts: where a place stands among the places listed with it, and how many of every 100 of its parent's people live in it.More in the glossary
About 1 of every 100 people in Samar lived in Pagsanghan in 2024 (1.01%)Inside itSources
13
barangays
LandSources
26.60 km²
of land, 2019 masterlistLand areaThe land inside the place's official boundary. A square kilometre is a square 1 km on each side, about the size of 140 football fields.Explained by Scene: Pagsanghan's land would fill a square about 5.2 km on each side. That is only a way to picture its size: its real shape is on the map.More in the glossary
Average density, 2024: 306 people per km²Population densityHow crowded a place is on average: its people divided by its land area. 1,000 people per square kilometre is 10 people per hectare, a square of 100 by 100 metres.Explained by Scene: About 3 people per hectare if everyone were spread evenly across the land. In fact people live closer together in towns and farther apart in the countryside.More in the glossaryHomesSources
1,935
households in 2024HouseholdA person living alone, or people who sleep in the same home and share their meals. A family may be one household or several.More in the glossary
4.2 people in each, on average, in 2024Town or countrySources
0%
Fewer than 1 of every 1,000 people lived in urban barangays in 2024Urban barangayThe PSA counts a barangay as urban when it has 5,000 people or more, or a big employer, or several businesses and public services close by. Every barangay in Metro Manila is urban.More in the glossary
- PSGC codePSGC codeThe code the Philippine Statistics Authority gives every place, so each one is known exactly, even when two share a name.More in the glossary
- 0806026000[4]Formerly 086026000
- ZIP code
- 6705[12, 13, 14]
People
Counts from 2000 on are on today’s borders; earlier counts are as the place was then, so the line may step where a border moved.
- 20Tagapul-An9,139
- 21San Sebastian9,110
- 22Almagro8,571
- 23Talalora8,530
- 24Pagsanghan8,145
- 25San Jose De Buan7,939
- 26Matuguinao7,708
- Santo Niño1,13814 in 100
- Canlapwas1,13614 in 100
- Libertad85811 in 100
- Villahermosa Occidental7219 in 100
- San Luis6378 in 100
- Bangon6087 in 100
- Villahermosa Oriental6027 in 100
- Buenos Aires5116 in 100
- Caloloma4756 in 100
- Viejo4576 in 100
- About 31 of every 100 are children under 15 (31.1%)
- About 62 of every 100 are of working age, 15 to 64 (62.1%)
- About 7 of every 100 are 65 or older (6.8%)
The figures by age
| Age | People | Men | Women |
|---|---|---|---|
| 0 - 4 | 677 | 336 | 341 |
| 5 - 9 | 879 | 470 | 409 |
| 10 - 14 | 916 | 474 | 442 |
| 15 - 19 | 927 | 454 | 473 |
| 20 - 24 | 682 | 352 | 330 |
| 25 - 29 | 512 | 273 | 239 |
| 30 - 34 | 412 | 216 | 196 |
| 35 - 39 | 451 | 234 | 217 |
| 40 - 44 | 443 | 226 | 217 |
| 45 - 49 | 453 | 237 | 216 |
| 50 - 54 | 412 | 223 | 189 |
| 55 - 59 | 363 | 178 | 185 |
| 60 - 64 | 288 | 149 | 139 |
| 65 - 69 | 178 | 90 | 88 |
| 70 - 74 | 143 | 63 | 80 |
| 75 - 79 | 118 | 45 | 73 |
| 80 years and over | 105 | 43 | 62 |
Every figure, census by census
- People, 2024 CensusCensusA count of every person in the country, all on one day. The 2024 census counted people as they were on 1 July 2024.More in the glossary
- 8,145[1, 2]
- Households, 2024HouseholdA person living alone, or people who sleep in the same home and share their meals. A family may be one household or several.More in the glossary
- 1,935[1, 2]
- People in each household, 2024
- 4.2 on average[1, 2]
- Share of Samar, 2024Rank and shareWorked out by Scene from the PSA's counts: where a place stands among the places listed with it, and how many of every 100 of its parent's people live in it.More in the glossary
- 1.01%[1]
- In urban barangays, 2024Urban barangayThe PSA counts a barangay as urban when it has 5,000 people or more, or a big employer, or several businesses and public services close by. Every barangay in Metro Manila is urban.More in the glossary
- 0% (0 people)[5]
- Men and women, 2020
- 4,063 men, 3,896 women[33]People living in households
| Census | Population | Growth since the census before | Households | People per household |
|---|---|---|---|---|
| 2024as of July 1, 2024 | 8,145[1, 2] | 0.56% a year | 1,935 | 4.2 |
| 2020as of May 1, 2020 | 7,959[1] | 0.04% a year | — | — |
| 2015as of August 1, 2015 | 7,945[1] | −0.19% a year | — | — |
| 2010as of May 1, 2010 | 8,024[1] | — | — | — |
| 2007as of August 1, 2007; as it was then | 7,981[31] | 1.67% a year | — | — |
| 2000as of May 1, 2000; on today’s borders | 7,077[31, 32] | −0.81% a year | — | — |
| 1995as of September 1, 1995; as it was then | 7,350[31] | 3.72% a year | — | — |
| 1990as of May 1, 1990; as it was then | 6,047[31] | −0.74% a year | — | — |
| 1980as of May 1, 1980; as it was then | 6,512[31] | — | — | — |
Barangays
| [2, 3, 5, 6, 7] | Share (2024) | Urban or rural | |||
|---|---|---|---|---|---|
| Bangon | 608 | 7.46% | 0.60% a year | about 0.976 km² | Rural |
| Buenos Aires | 511 | 6.27% | −3.23% a year | about 5.10 km² | Rural |
| Calanyugan | 392 | 4.81% | −0.66% a year | about 4.36 km² | Rural |
| Caloloma | 475 | 5.83% | 3.23% a year | about 4.21 km² | Rural |
| Cambaye | 263 | 3.23% | −2.40% a year | about 1.01 km² | Rural |
| Canlapwas | 1,136 | 13.95% | 1.09% a year | about 2.21 km² | Rural |
| Libertad | 858 | 10.53% | −1.91% a year | about 1.41 km² | Rural |
| Pañge | 347 | 4.26% | 0.56% a year | about 3.89 km² | Rural |
| San Luis | 637 | 7.82% | −0.81% a year | about 4.60 km² | Rural |
| Santo Niño | 1,138 | 13.97% | 2.93% a year | about 1.45 km² | Rural |
| Viejo | 457 | 5.61% | −1.46% a year | about 0.0527 km² | Rural |
| Villahermosa Occidental | 721 | 8.85% | 3.69% a year | about 1.90 km² | Rural |
| Villahermosa Oriental | 602 | 7.39% | 2.60% a year | about 2.22 km² | Rural |
Areas are approximate: each is measured inside the barangay's border on UN OCHA's map, which is a guide, not the legal boundary.
Land & Environment
- Land areaLand areaThe land inside the place's official boundary. A square kilometre is a square 1 km on each side, about the size of 140 football fields.More in the glossary
- 26.60 km²[6]As listed in the 2019 Masterlist of Land Areas (LMB, DENR)
- Average density, 2024Population densityHow crowded a place is on average: its people divided by its land area. 1,000 people per square kilometre is 10 people per hectare, a square of 100 by 100 metres.More in the glossary
- 306 people per km²[6]
- Coordinates
- 11.96584° N, 124.74442° E[3]The point inside its border farthest from every edge, so it always falls within the place.
- Lowest
- Sea level
- Average
- 20 m
- Highest
- 132 m
Heights from the Copernicus DEM, a 30 m model of the surface: it reads the tops of trees and roofs, not the bare ground, over the land inside the border, the sea left out. Produced using Copernicus WorldDEM-30 © DLR e.V. 2010-2014 and © Airbus Defence and Space GmbH 2014-2018 provided under COPERNICUS by the European Union and ESA; all rights reserved.
Water, coast and peaks
6.7 km of coastline[28]
Named rivers, lakes and peaks as OpenStreetMap mapped them on 30 September 2026, and the coast within 150 m of the border. Map data © OpenStreetMap contributors, under the Open Database License.
Climate
Climate typeClimate typePAGASA sorts the country's climate into four types by when the rain falls. Type I has a dry season from November to April and a wet one for the rest of the year; Type II has no dry season, with the most rain from December to February; Type III has a short dry season; Type IV has rain spread through the year.More in the glossary
Type IV[29]
Rain spread fairly evenly through the year, with no dry season.
Read by Scene off PAGASA's climate map, so approximate: the type that covers most of the place's land.
Rain each month Average temperature
The figures by month
| Month | Rain | Rainy days | Average | High | Low |
|---|---|---|---|---|---|
| January | 296 mm | 16 | 26.7 °C | 30.8 °C | 22.7 °C |
| February | 208 mm | 12 | 27.0 °C | 31.4 °C | 22.6 °C |
| March | 191 mm | 13 | 28.6 °C | 32.4 °C | 23.2 °C |
| April | 124 mm | 11 | 28.8 °C | 33.5 °C | 24.1 °C |
| May | 179 mm | 12 | 29.5 °C | 33.9 °C | 25.0 °C |
| June | 230 mm | 15 | 29.2 °C | 33.4 °C | 25.0 °C |
| July | 292 mm | 17 | 28.8 °C | 32.7 °C | 24.9 °C |
| August | 196 mm | 12 | 29.1 °C | 32.9 °C | 25.3 °C |
| September | 280 mm | 15 | 28.9 °C | 32.8 °C | 24.9 °C |
| October | 299 mm | 19 | 28.4 °C | 32.3 °C | 24.4 °C |
| November | 293 mm | 19 | 27.8 °C | 31.9 °C | 23.8 °C |
| December | 404 mm | 20 | 27.3 °C | 31.2 °C | 23.4 °C |
| The year | 2,991 mm | 181 | 28.4 °C | 32.4 °C | 24.1 °C |
A station's figures describe the place around it only roughly: inland and in the hills it may be cooler and wetter. The station stands 5 m above the sea.
Life & Economy
- Poverty, 2021Poverty incidenceHow many of every 100 people live in families whose income is below the poverty line: what a person needs in a year for food and other basic needs, as the PSA sets it for each province. It is an estimate, from a survey or, for a town, a statistical model, so the PSA gives a range it is likely to fall in.More in the glossary
- 30.2% of people[17]Below the poverty line, by the PSA's estimate for every town.
- Income classIncome classThe Department of Finance sorts provinces, cities and municipalities into classes by their average yearly income over recent years: 1st class has the most. It measures the local government's income, not how well off its people are.More in the glossary
- 5th class[4]
The PSA's model for every town puts it between 25.0% and 35.4%, with 90% confidence.
The PSA rates this estimate's reliability as acceptable rather than high: read it as a guide.
Public places
- 12government offices
- 11schools
- 3places of worship
- 1market
Counted from OpenStreetMap[3, 8]. Schools, places of worship, barangay halls and places known only by a common name, such as a chapel, are listed on each barangay's page.
Where a kind has more than 8, this page shows 6: first those with “Pagsanghan” in their name, then one in each of its most populous barangays.
Government offices11
- Pagsanghan Townhall · Santo Niño
- Pagsanghan Fire Station · Viejo
- Municipal Health Office · Canlapwas
- Pagsanghan Post Office · Santo Niño
- Pagsanghan Police Station · Viejo
- Pagsanghan Municipal Assessors Office · Santo Niño
5 more government offices are listed on the pages of the barangays they stand in. See the 13 barangays of Pagsanghan
Markets1
As OpenStreetMap maps them on September 30, 2026. Map data © OpenStreetMap contributors, under the Open Database License.
Government & Leaders
A mayor leads Pagsanghan. Its local laws, called ordinances, are passed by the Sangguniang Bayan (the municipal council), led by the vice mayor. The mayor, the vice mayor and the council's elected members serve three-year terms, and none may serve more than three in a row.[10, 11]
- Legislative districtLegislative districtThe area that elects one member of the House of Representatives. A big province or city may have several.More in the glossary
- 1st district of Samar[15, 16]
Leaders
The mayor and vice mayor elected at each election since 2001, as COMELEC's lists of the elected name them, and those in office now, as the DILG's directory lists them.
2025–2028In office as of February 2026
2022–2025
2019–2022
2016–2019
2013–2016
2010–2013
2007–2010
2004–2007
2001–2004
| Term | Mayor | Vice mayor |
|---|---|---|
| 2025–2028In office as of February 2026 | Sed Hendrix Calagos Tan[18] | Renato Lapiceros Pedrita[18] |
| 2022–2025 | Sed Hendrix Calagos Tan[19] | Renato Lapiceros Pedrita[19] |
| 2019–2022 | Edgar Ceracas Tan[20] | Bienvenida Planteras Repol[20] |
| 2016–2019 | Edgar Ceracas Tan[21] | Bienvenida Planteras Repol[21] |
| 2013–2016 | Edgar Ceracas Tan[22] | Bienvenida Planteras Repol[22] |
| 2010–2013 | Ruben Tan Palma[23] | Alicia Uy Repol[23] |
| 2007–2010 | Violeto Herrera Ceracas[24] | Edgar Ceracas Tan[24] |
| 2004–2007 | Violeto Ceracas[25] | Alberto Mara[25] |
| 2001–2004 | Violeto H. Ceracas[26] | Alicia U. Repol[26] |
History & Identity
Stories from Eastern Visayas
Pagsanghan has no Story of its own yet. This one is about Eastern Visayas, which Pagsanghan is part of.

- Created
- Batas Pambansa Blg. 16, approved on 9 February 1979, separated nine barangays of Tarangnan to form the municipality of Pagsanghan, with its seat at Barangay Pagsanghan. The town came into existence on ratification in a plebiscite held in Tarangnan. (Lawphil prints the title as Pagsanjan, but the text says Pagsanghan.)[9]
Nearby
How it compares
Pagsanghan beside Samar, and where it stands among the cities and municipalities of Samar.
| Figure | Pagsanghan | Samar | Rank among the cities and municipalities of Samar |
|---|---|---|---|
| People, 2024CensusA count of every person in the country, all on one day. The 2024 census counted people as they were on 1 July 2024.More in the glossary | 8,145[1, 2] | 806,179 | 24th of 26 |
| Growth a year, 2020–2024Growth a yearHow fast the number of people changed each year between two censuses. 1% a year means about 1 more person for every 100 people, each year.More in the glossary | 0.56% a year[1, 2]faster | 0.39% a year | 10th of 26 |
| People per km², 2024Population densityHow crowded a place is on average: its people divided by its land area. 1,000 people per square kilometre is 10 people per hectare, a square of 100 by 100 metres.More in the glossary | 306[6]more crowded | 149 | 7th of 26 |
| Land areaLand areaThe land inside the place's official boundary. A square kilometre is a square 1 km on each side, about the size of 140 football fields.More in the glossary | 26.60 km²[6] | 5,414.68 km² | 25th of 26 |
| People in each household, 2024HouseholdA person living alone, or people who sleep in the same home and share their meals. A family may be one household or several.More in the glossary | 4.2[1, 2]higher | 4.1 | not ranked |
| In urban barangays, 2024Urban barangayThe PSA counts a barangay as urban when it has 5,000 people or more, or a big employer, or several businesses and public services close by. Every barangay in Metro Manila is urban.More in the glossary | 0%[5]lower | 14.9% | not ranked |
Shares a border with[3]
How far, in a straight line[3]
- Catbalogan City, the capital of Samar
- 20.8 km southeast
- Manila
- 500.3 km northwest
In a straight line between the points inside each place farthest from its edges, not by road.
The nearest towns and cities[3]
- TarangnanSamar4.6 km southeast
- Santa MargaritaSamar10.3 km northwest
- GandaraSamar16.0 km northeast
- San JorgeSamar17.1 km east
- Catbalogan CitySamar20.8 km southeast
- JiabongSamar28.5 km east
Sources
- 1.Philippine Statistics Authority. Population and Annual Population Growth Rate of the Philippines and its Regions, Provinces, and Highly Urbanized Cities Based on the 2010, 2015, 2020 and 2024 Population Census (OpenSTAT table 0211A6DAPG0). Published August 7, 2026. Read by Scene October 2, 2026. CC BY (PSA Terms of Use). Open the source
- 2.Philippine Statistics Authority. Total Population, Household Population, and Number of Households by Province, City, Municipality, and Barangay as of 01 July 2024: Eastern Visayas (OpenSTAT table 0081A6DTPH7). Published August 5, 2026. Read by Scene October 2, 2026. CC BY (PSA Terms of Use). Open the source
- 3.UN OCHA, from the PSA and NAMRIA. Philippines: Subnational Administrative Boundaries (COD-AB), barangay layer. Published February 13, 2025. Read by Scene September 25, 2026. CC BY-IGO 3.0. Open the source
- 4.Philippine Statistics Authority. Philippine Standard Geographic Code (PSGC), 2nd Quarter 2026: Publication Datafile. Published June 30, 2026. Read by Scene September 24, 2026. CC BY (PSA Terms of Use). Open the source
- 5.Philippine Statistics Authority. Total Population and Urban Population by Urban Classification and Region, Province, Highly Urbanized City, City/Municipality and Barangay: Philippines, 2024 (OpenSTAT table 0231A6DPUP0). Published August 7, 2026. Read by Scene October 2, 2026. CC BY (PSA Terms of Use). Open the source
- 6.Philippine Statistics Authority, from the Land Management Bureau (DENR). Population, Land Area, Population Density, and Percent Change in Population Density by Region, Province/Highly Urbanized City, and City/Municipality: 2015, 2020, and 2024 (OpenSTAT table 0221A6DLPD0). Published August 7, 2026. Read by Scene October 2, 2026. CC BY (PSA Terms of Use). Open the source
- 7.Philippine Statistics Authority. Philippine Standard Geographic Code (PSGC), 4th Quarter 2022: Publication Datafile, with the 2015 and 2020 census counts (the PSA's file, as the Internet Archive keeps it). Published December 31, 2022. Read by Scene October 2, 2026. CC BY (PSA Terms of Use). Open the source
- 8.OpenStreetMap contributors. Named public places in OpenStreetMap: schools, hospitals and health centres, places of worship, government offices, markets, stations, parks, beaches and monuments, from Geofabrik's extract of the Philippines. Published September 30, 2026. Read by Scene October 2, 2026. ODbL 1.0. Open the source
- 9.The Lawphil Project. Batas Pambansa Blg. 16 (1979), An Act Creating the Municipality of Pagsanghan in the Province of Samar. Published February 9, 1979. Read by Scene October 3, 2026. Philippine government work, no copyright (Republic Act No. 8293, Section 176.1). Open the source
- 10.Congress of the Philippines. Republic Act No. 7160: the Local Government Code of 1991. Published October 10, 1991. Read by Scene October 2, 2026. Philippine government work, no copyright (Republic Act No. 8293, Section 176.1). Open the source
- 11.1986 Constitutional Commission. The 1987 Constitution of the Republic of the Philippines. Published February 2, 1987. Read by Scene October 2, 2026. Philippine government work, no copyright (Republic Act No. 8293, Section 176.1). Open the source
- 12.Philippine Postal Corporation (PHLPost). ZIP Code Locator. Read by Scene October 2, 2026. Philippine government work, no copyright (Republic Act No. 8293, Section 176.1; a government-owned corporation's work is the Government's, Section 171.9). Open the source
- 13.Philippine Postal Corporation (PHLPost). ZIP Code Locator, as the Internet Archive captured it on 2022-05-21 (its SHA-1 matches the Archive's index). Published May 21, 2022. Read by Scene October 2, 2026. Philippine government work, no copyright (Republic Act No. 8293, Section 176.1; a government-owned corporation's work is the Government's, Section 171.9). Open the source
- 14.Philippine Postal Corporation (PHLPost). Philippine ZIP Codes (the directory "ZipCode 2019.pdf", made 2019-12-02), as the Internet Archive keeps it (its SHA-1 matches the Archive's index). Published December 2, 2019. Read by Scene October 2, 2026. Philippine government work, no copyright (Republic Act No. 8293, Section 176.1; a government-owned corporation's work is the Government's, Section 171.9). Open the source
- 15.1986 Constitutional Commission (text from the Chan Robles Virtual Law Library). Ordinance appended to the 1987 Constitution, apportioning the seats of the House of Representatives. Published February 2, 1987. Read by Scene October 2, 2026. Philippine government work, no copyright (Republic Act No. 8293, Section 176.1). Open the source
- 16.Commission on Elections (COMELEC). 2025 National and Local Elections: results, certificates of canvass of every province, city and municipality. Published May 2025. Read by Scene October 2, 2026. Philippine government work, no copyright (Republic Act No. 8293, Section 176.1). Open the source
- 17.Philippine Statistics Authority. Municipal and City Level Small Area Poverty Estimates; 2018 and 2021 (the PSA's workbook "2018 - 2021 SAE_with PSGC_noHUC.xlsx", sheet "2018-2021_NoHUC", as the Internet Archive keeps it). Published April 2, 2024. Read by Scene October 2, 2026. CC BY (PSA Terms of Use). Open the source
- 18.Department of the Interior and Local Government (DILG). Directory of LGU Elective Officials for Term 2025-2028 as of February 2026 (its sheet: Consolidated List of Officials for Election Terms (2025-2028)), released through the FOI portal. Published February 2026. Read by Scene October 2, 2026. A work of the Government of the Philippines: RA 8293, Section 176 (no copyright subsists in it; exploiting it for profit needs the agency's prior approval). Open the source
- 19.Commission on Elections (COMELEC), Records and Statistics Division, ERSD. List of Elected City/Municipal Candidates, May 9, 2022 National and Local Elections. Published December 23, 2025. Read by Scene October 2, 2026. Public domain: comelec.gov.ph says "All content is in the public domain unless otherwise stated." Each list carries COMELEC's data privacy notice (RA 10173).. Open the source
- 20.Commission on Elections (COMELEC), Records and Statistics Division, ERSD. List of Elected City/Municipal Candidates, May 13, 2019 National and Local Elections. Published December 23, 2025. Read by Scene October 2, 2026. Public domain: comelec.gov.ph says "All content is in the public domain unless otherwise stated." Each list carries COMELEC's data privacy notice (RA 10173).. Open the source
- 21.Commission on Elections (COMELEC), Records and Statistics Division, ERSD. List of Elected City/Municipal Candidates, May 9, 2016 National and Local Elections (its pages are headed "LIST OF ELECED CITY/MUNICIPAL CANDIDATES"). Published January 12, 2026. Read by Scene October 2, 2026. Public domain: comelec.gov.ph says "All content is in the public domain unless otherwise stated." Each list carries COMELEC's data privacy notice (RA 10173).. Open the source
- 22.Commission on Elections (COMELEC), Records and Statistics Division, ERSD. List of Elected City/Municipal Candidates, May 13, 2013 National and Local Elections. Published January 12, 2026. Read by Scene October 2, 2026. Public domain: comelec.gov.ph says "All content is in the public domain unless otherwise stated." Each list carries COMELEC's data privacy notice (RA 10173).. Open the source
- 23.Commission on Elections (COMELEC), Records and Statistics Division, ERSD. List of Elected City/Municipal Candidates, May 10, 2010 National and Local Elections. Published January 8, 2026. Read by Scene October 2, 2026. Public domain: comelec.gov.ph says "All content is in the public domain unless otherwise stated." Each list carries COMELEC's data privacy notice (RA 10173).. Open the source
- 24.Commission on Elections (COMELEC), Records and Statistics Division, ERSD. List of Elected City/Municipal Candidates, May 14, 2007 National and Local Elections. Published January 14, 2026. Read by Scene October 2, 2026. Public domain: comelec.gov.ph says "All content is in the public domain unless otherwise stated." Each list carries COMELEC's data privacy notice (RA 10173).. Open the source
- 25.Commission on Elections (COMELEC), Records and Statistics Division, ERSD. List of Elected City/Municipal Candidates, May 10, 2004 National and Local Elections (its pages are headed "LIST OF CITY/MUNICIPAL CANDIDATES"). Published January 14, 2026. Read by Scene October 2, 2026. Public domain: comelec.gov.ph says "All content is in the public domain unless otherwise stated." Each list carries COMELEC's data privacy notice (RA 10173).. Open the source
- 26.Commission on Elections (COMELEC), Records and Statistics Division, ERSD. List of Elected City/Municipal Candidates, May 14, 2001 National and Local Elections. Published January 8, 2026. Read by Scene October 2, 2026. Public domain: comelec.gov.ph says "All content is in the public domain unless otherwise stated." Each list carries COMELEC's data privacy notice (RA 10173).. Open the source
- 27.European Union and the European Space Agency (Copernicus), from DLR and Airbus Defence and Space (WorldDEM). Copernicus DEM GLO-30: global digital surface model at 30 m, one-degree tiles (2021 release). Published 2021. Read by Scene October 2, 2026. Copernicus DEM GLO-30 licence: free, any use including commercial, with the Copernicus notice. Open the source
- 28.OpenStreetMap contributors, extract by Geofabrik. Named rivers, lakes, reservoirs, peaks and the coastline of the Philippines in OpenStreetMap (Geofabrik extract, cut by osmium). Published September 30, 2026. Read by Scene October 2, 2026. ODbL 1.0. Open the source
- 29.Philippine Atmospheric, Geophysical and Astronomical Services Administration (PAGASA), Climatology and Agrometeorology Division. Climate Map of the Philippines (1951-2010), Modified Coronas Climate Classification. Published August 2014. Read by Scene October 2, 2026. A work of the Government of the Philippines: no copyright (RA 8293 s.176.1); PAGASA's approval is needed to use it for profit. Open the source
- 30.Philippine Atmospheric, Geophysical and Astronomical Services Administration (PAGASA), Climatology and Agrometeorology Division. Climatological Normals, 1991-2020, by synoptic station (one PDF each). Published January 2022. Read by Scene October 2, 2026. A work of the Government of the Philippines: no copyright (RA 8293 s.176.1); PAGASA's approval is needed to use it for profit. Open the source
- 31.Philippine Statistics Authority. 2015 Census of Population, Statistical Tables, Table 1: Population Enumerated in Various Censuses by City/Municipality, 1960-2015 (one workbook for each province, highly urbanized city and region). Published 2017. Read by Scene October 2, 2026. CC BY (PSA Terms of Use). Open the source
- 32.Philippine Statistics Authority. 2020 Census of Population and Housing: Table A (Population and Annual Growth Rate for the Philippines and its Regions, Provinces and Highly Urbanized Cities) and Table B (Population and Annual Growth Rates by Province, City and Municipality, by Region). Published July 2021. Read by Scene October 2, 2026. CC BY (PSA Terms of Use). Open the source
- 33.Philippine Statistics Authority. 2020 Census of Population and Housing: Household Population by Age Group and Sex, for the Philippines and its regions, provinces, cities and municipalities (revised file, psa.gov.ph/system/files/phcd/2022-12/). Published December 2022. Read by Scene October 8, 2026. CC BY (PSA Terms of Use). Open the source
Scene adds what the sources do not print themselves: growth rates, shares, barangay areas and densities, coordinates, neighbours and distances, each computed from the figures and borders above. How each is made.
See something wrong on this page? Write to hello@scene.ph with the page address. We check every report against the source.
Cite this page
Scene.ph. “Pagsanghan, Samar.” Scene Atlas. Updated October 9, 2026. https://scene.ph/atlas/samar/pagsanghan